“If you invest in proper data collection and reporting, you will reap the benefits indefinitely.”
– Chuck Cohn, Forbes.com
Operating a retail business? You’re going to need a reporting tool. It’s that simple.
These days, business intelligence and analytics are par for the retailing course. The ability to step back and examine overarching buyer trends on a massive scale has revolutionized the commercial landscape and provided retailers with a virtual crystal ball—a process by which they can gain insight, “predict” the future with the help of identifiable consumer habits and, ultimately, increase revenue. Reporting—the front line of this sophisticated numbers game, in which raw, hour-by-hour purchase data is organized according to specified categories—is therefore an essential piece of any retail business puzzle. Indeed, reporting has become so essential that nearly 80% of the 3,000 international companies polled as part of the Dresner Advisory Services 2017 Advanced and Predictive Analytics Market Study cited “reporting” as either “critical” or “very important” to the overall strategic growth of their respective organizations. It’s that serious, folks.
Okay, okay. Odds are you knew most of this already. You’re a retailer, after all. You’ve probably installed (or at least investigated) a reporting service well before you clicked on this post. Good job.
But does your reporting solution offer you maximum flexibility and a borderline ridiculous amount of options? Can you rely on your reporting service to have the versatility necessary to let you customize the kinds of reports you want to see? With your specially tailored rows and columns? Categorized by your preferred customer demographics?
If you answered “no” to any of the above questions, you most likely haven’t encountered the Erply Report Generator as of yet. Maybe it’s time we introduced you.
Meet the Erply Report Generator
In addition to its comprehensive lineup of report templates (90+ to date and counting), Erply provides users with an easily accessible yet highly sophisticated method of creating customized reports, amounting to a business intelligence solution that’s uniquely adaptable to each client’s needs. Reports built in the Report Generator allow Erply POS customers to design their own special microscope with which to analyze sales, consumer history, employee activity, individual storefront traffic and much, much more. Information groupings and displays are left almost entirely up to the account holder, and no job is too big or too small—no data field too broad or too insignificant. If it’s helpful to you and your business, you’ll most likely be able to see it charted on a report.
Curious to learn more? Take a look at some of the Report Generator’s most helpful and innovative features:
Versatility and Flexibility in Reporting
As hinted above, the Report Generator opens up a world of possibility for any Erply users hoping to construct one-of-a-kind reports based on their point-of-sale statistics. Once you open the generator, a wealth of data field options and demographic filters become instantly available to you. And no one’s judging how you pick and choose. Mix and match according to the nature of your business. Narrow your information by date, time, specific customer, method of invoice…almost anything you like. Use this accumulated info to get a complete view of our business’s big picture. Translate cold, hard sales facts into actionable intel…we promise we won’t tell anyone exactly how you did it.
Here’s just a small sampling of the types of categories you can employ when using the Report Generator:
- Type of payment
- Mode of transaction
- Location
- Tax rate
- Customer name
- Customer address
- Product
- Discounts given
Filter Your Data
Want to focus your reporting so that it only covers a limited date range, a certain kind of invoice or a particular storefront? The Report Generator lets you do that. Each data field within a generated report is fitted with an optional filter for various “constraints and conditions” based on your desired business perspective. Looking to give board members and overview of your profits for the final quarter? Simply click on the drop-down menu under your “Date” data field and plug in your preferred months. (Erply even provides you with some more common date range selections, just to make things that much easier.)
Hoping to keep all of your data in one place but also to segment it so that it’s displayed in an order that’s as clear and constructive as possible? The Report Generator can handle that, too. Row ordering on any report can be completely customized—and you can even set a “primary” and “secondary” ordering that caters to your tastes.
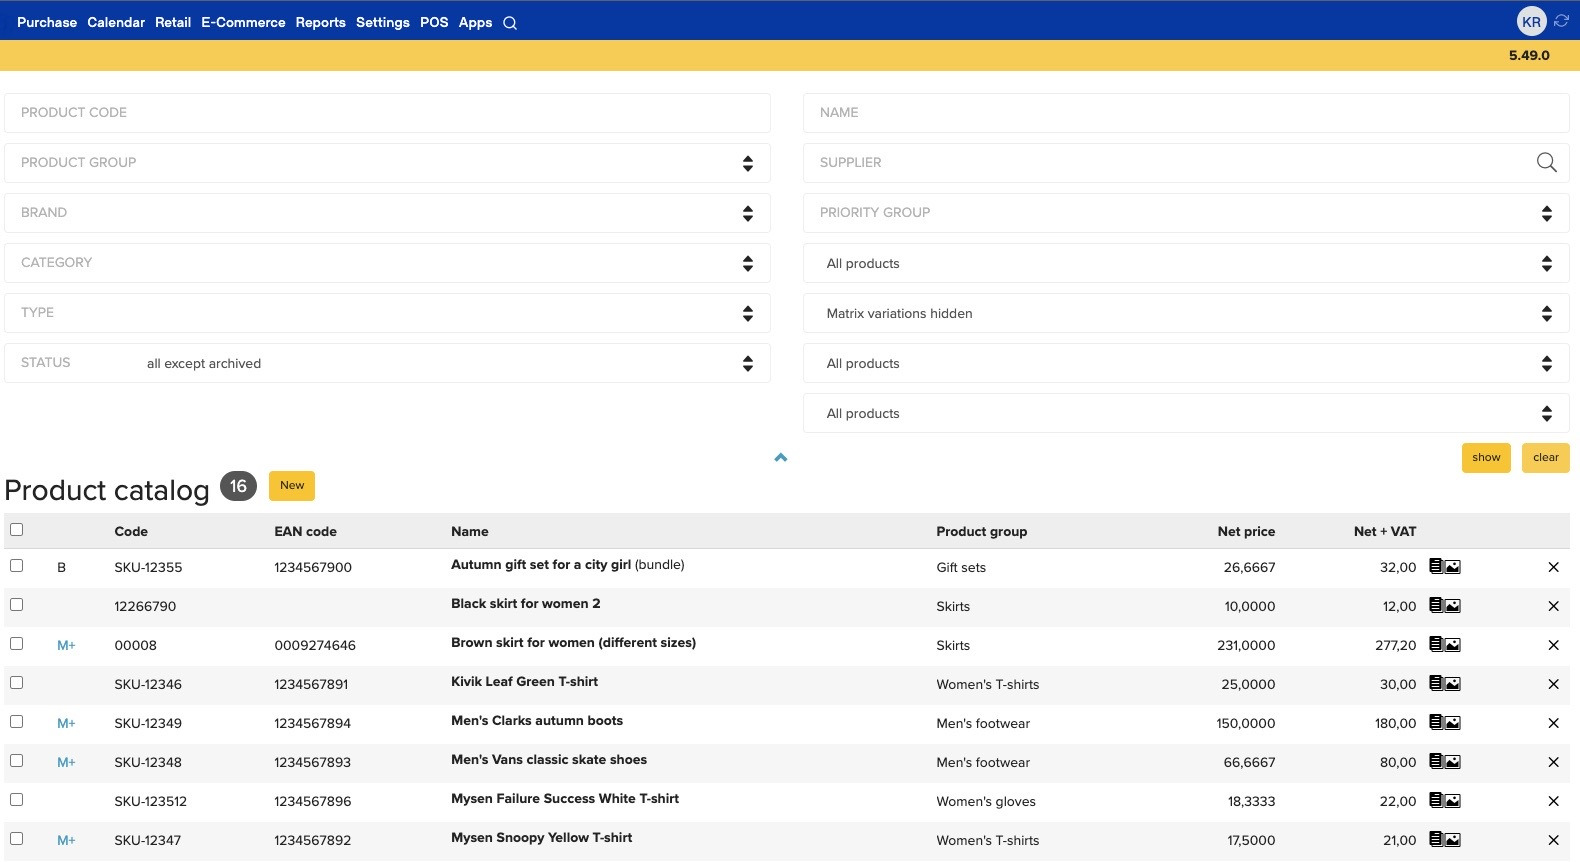
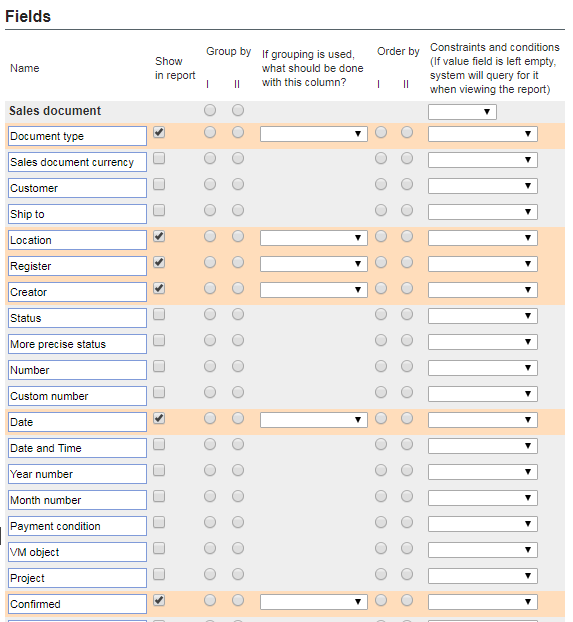
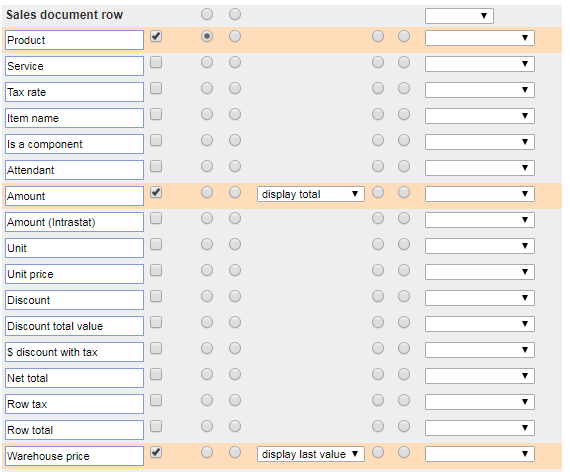
Here’s an example of a detailed report you can create with the report generator.
Select these options in the interface:
And the result will look like this:

Organize Your Data, Export Your Findings.
Columns created using the Report Generator can be grouped together to form unique subtotals according to your specifications. For example: You can link “customer,” “payment,” “location” and “date” columns to build a “totals by day” grouping that highlights daily earnings for each of your individual stores. Similarly, you can also create an “aggregate report” in which each row yields a number that represents a “grouping” of data (i.e. a subtotal) rather than a singular, free-floating bit of information. Never has the scope of your business been easier to take in.
In addition, once you’re done reviewing your business activities, you can seamlessly export all of your findings to Excel. This makes conversations with your accountants much more comfortable and can take a lot of the guesswork out of tax season. Plus, since Excel is such an instantly recognizable format, your exported reports can be shared effortlessly with relevant staff members, potential investors and company strategists (at your own discretion, of course). And Excel will enable you to translate your carefully prepared reports into easily digestible charts and graphs for anyone who needs a more visual representation of business operations.
And that’s not all…
The introduction is only the beginning of what we hope will be a beautiful friendship. Erply’s dedicated staff is on call to help guide you through the nuts and bolts of the Report Generator and to get you further acquainted with all of the many, many reporting capabilities the platform affords. Come see what the Report Generator can bring to the table for you and your business. Take advantage of Erply’s backend inventory features and start reaping the full benefits of reporting by familiarizing yourself with the Report Generator.
We’ll be happy to get you started.
Sign Up