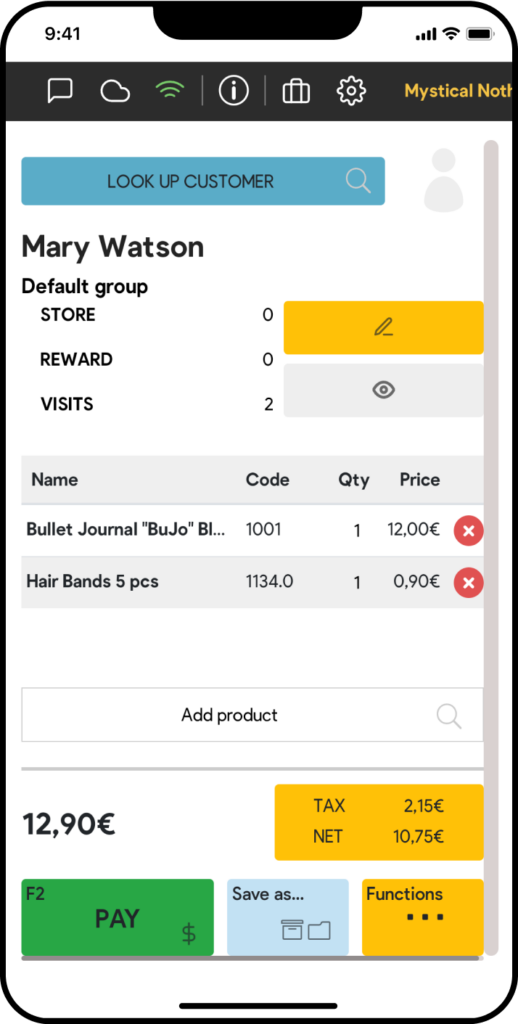
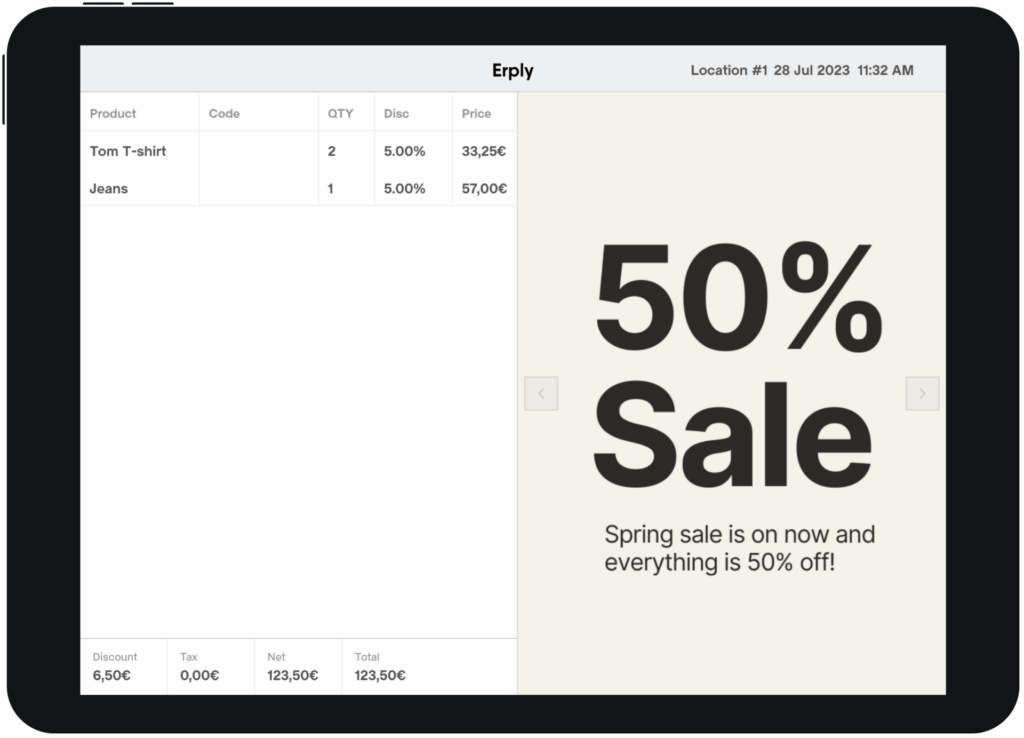
With the flexibility of the Customer Display app, improve your relationships with your customers and simplify the checkout process. Display dynamic transaction information at the register and even advertise promotions and branded imagery between each sale.
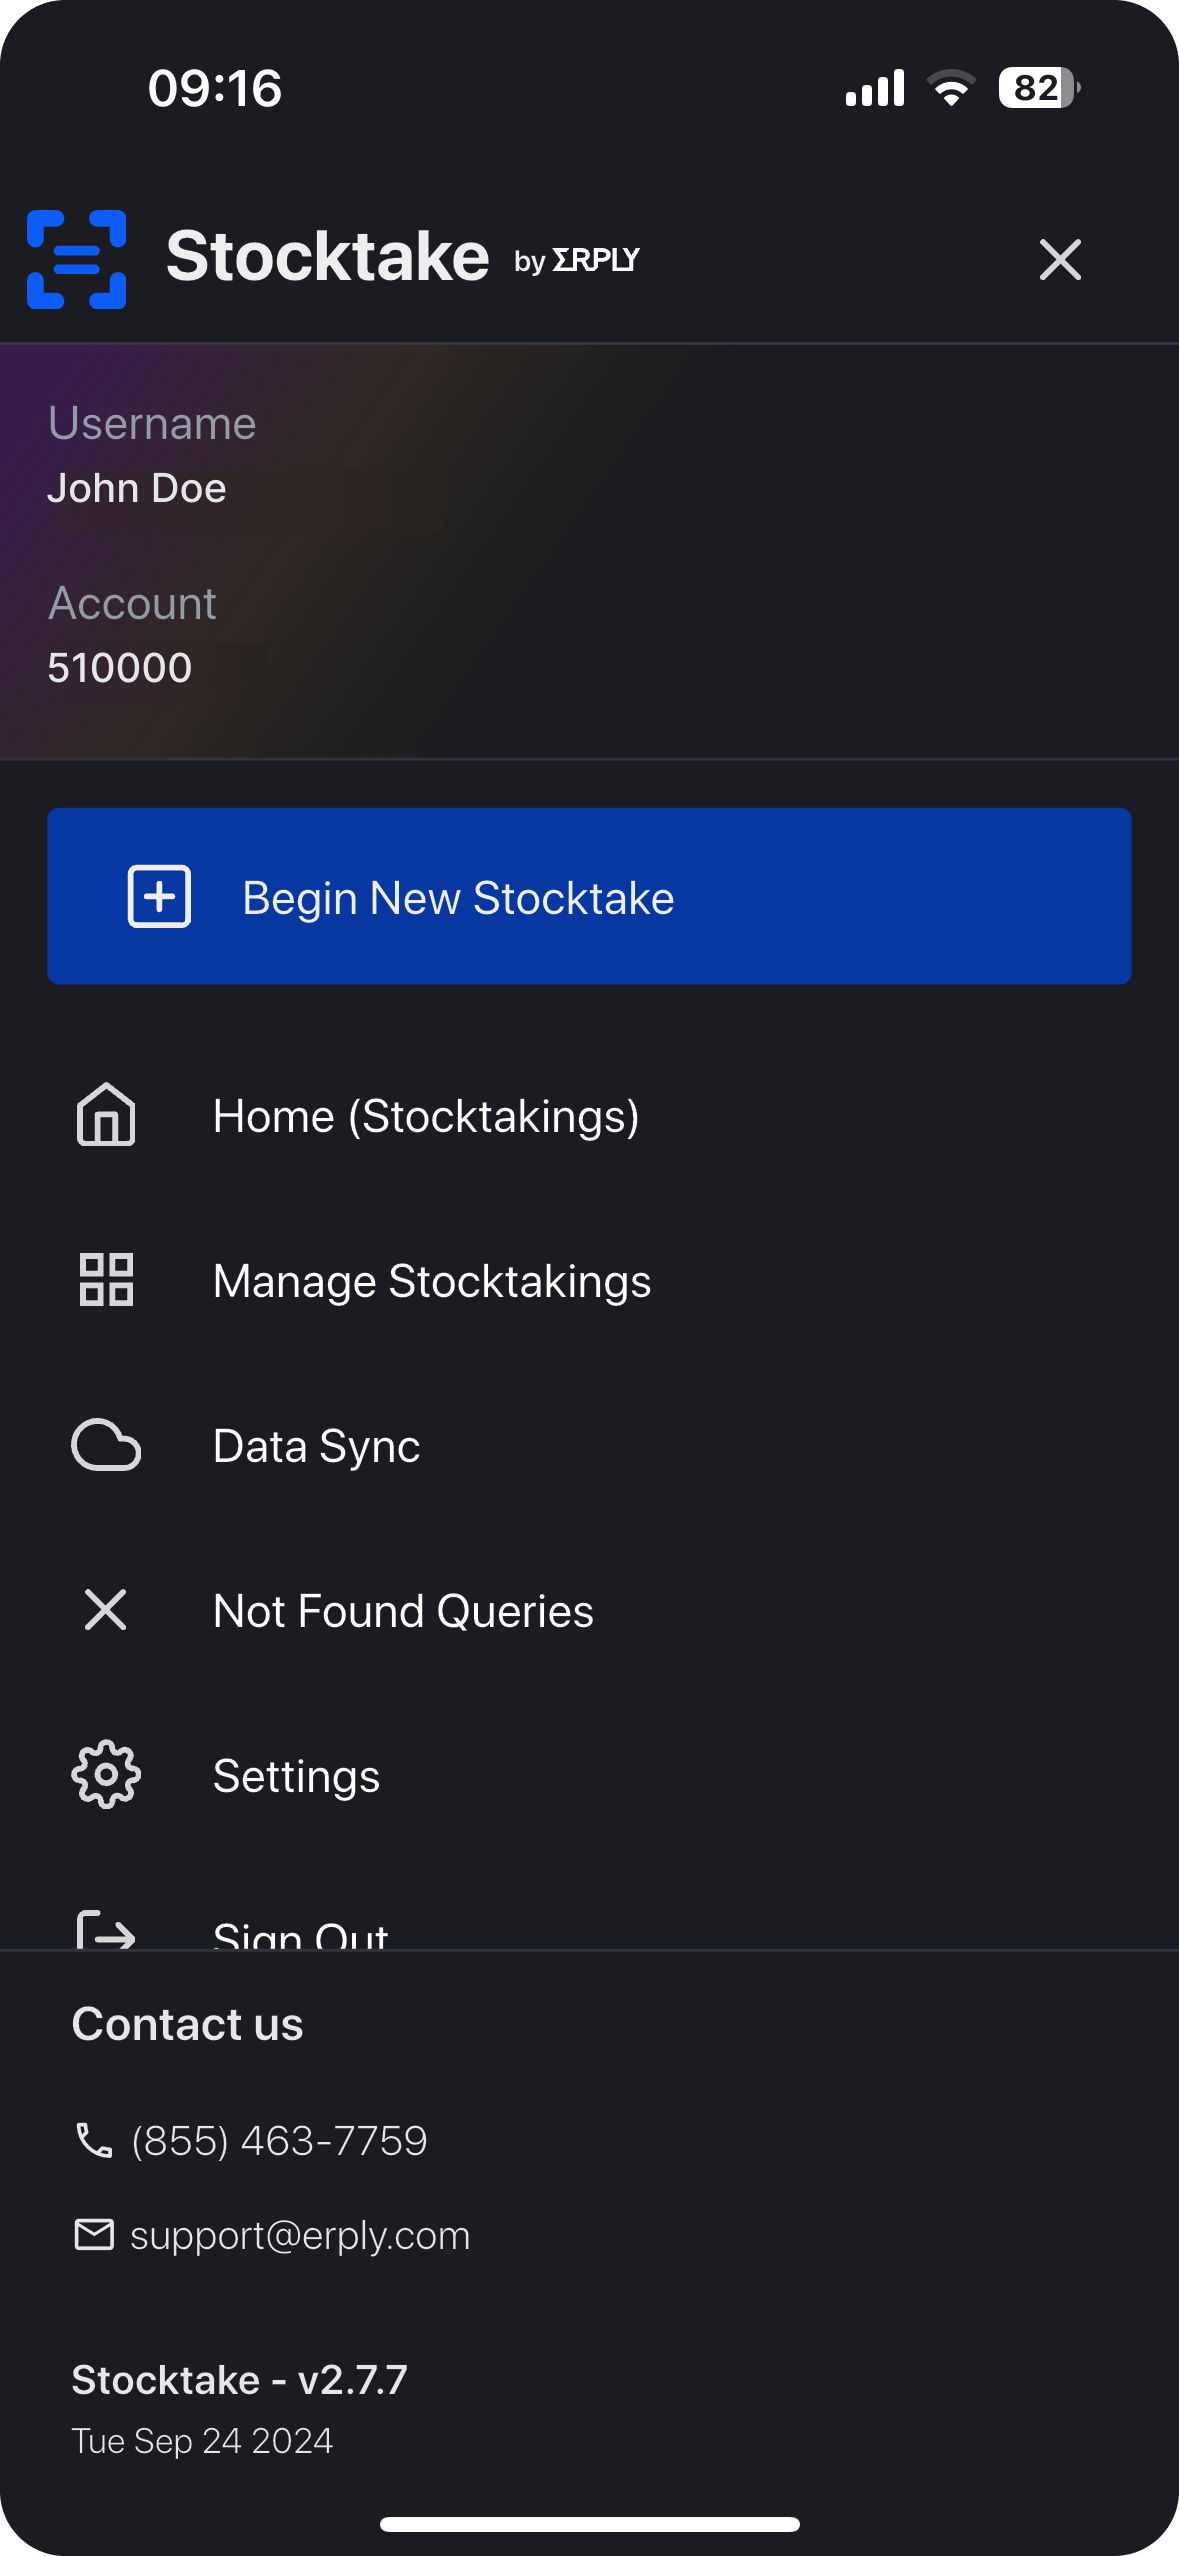
Looking for a paperless stocktaking solution that synchronizes all warehouse operations across your entire retail chain?
Erply Stocktake takes the burden out of maintaining inventory counts. The Erply’s mobile stocktaking tool saves your time in the warehouse and provides you stronger inventory data insights. Spend less time counting inventory and more time running your business.