Forecasting sales is crucial when planning inventory and stocking up. Although the forecast is usually based on prior sales, several other things, e.g. general economic climate, changes in sales staff, increases in customer discounts, trends, etc., factor in.
Erply’s sales forecasting plugin makes it easier to forecast sales by taking into account the products or goods you already have in stock and comparing these to what you intend to sell. In short, it lets you know what your store needs.
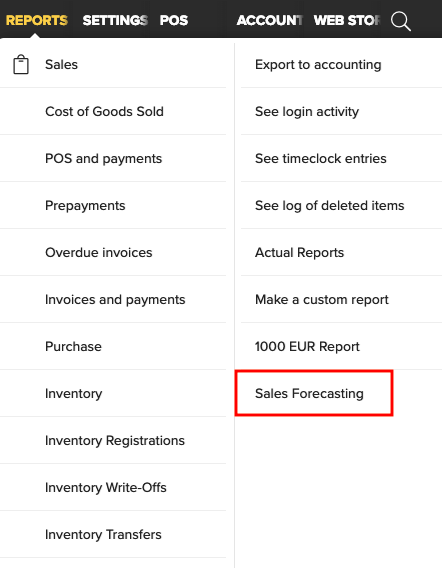
The plugin generates a new button under Reports:
When you click on the button then opens the following message:
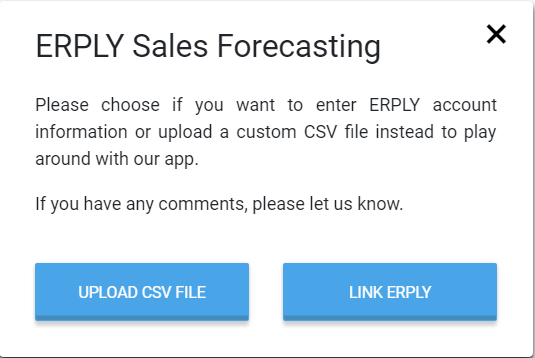
You can also use the program by uploading a csv file, but here we are only going to cover the data available on Erply. Click on the button “LINK ERPLY” to open the following view:
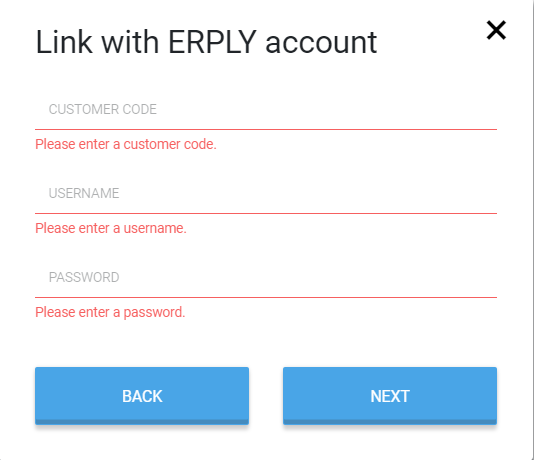
Enter your Erply customer code (ID number), username and password.
Click “NEXT” to continue; the following will be displayed:
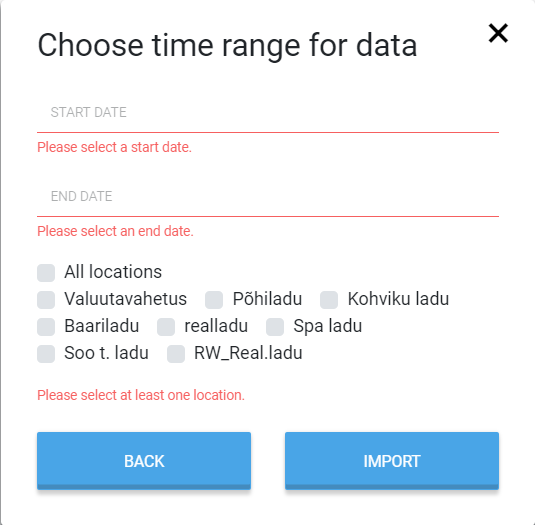
We recommend selecting as long of a date range as possible for a more accurate forecast. Be sure to select a specific warehouse or all warehouses combined. E.g.:
Once you have made your selection, click “IMPORT“. The following notification will be displayed:
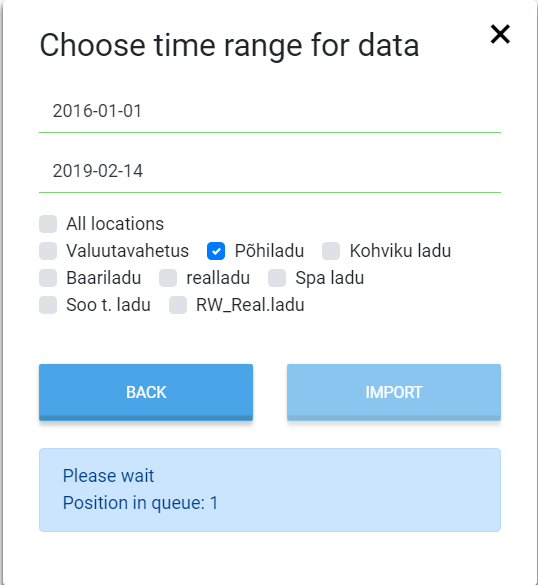
Wait until the prompt “DONE” is displayed. Note! Try and be patient. If there is a lot of data, the process can take quite a bit of time.
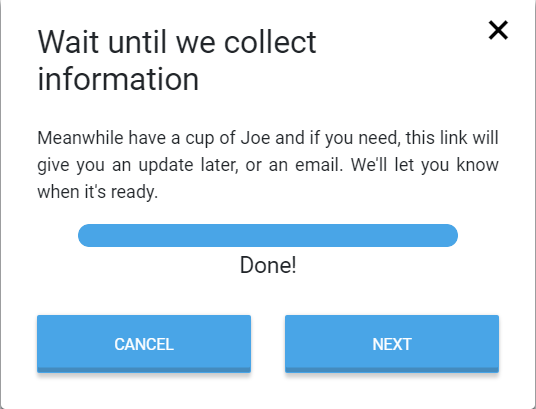
Continue by clicking “NEXT“. The following view will be displayed:
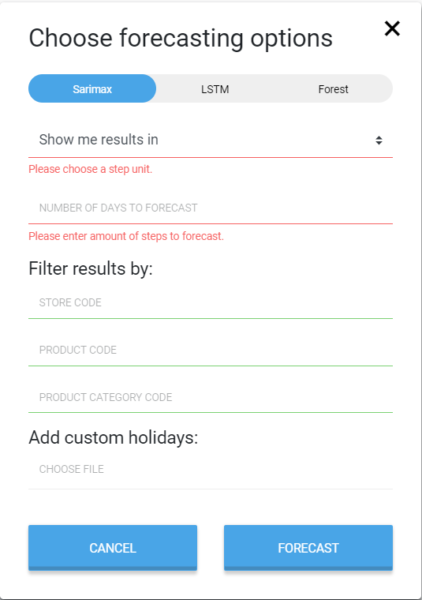
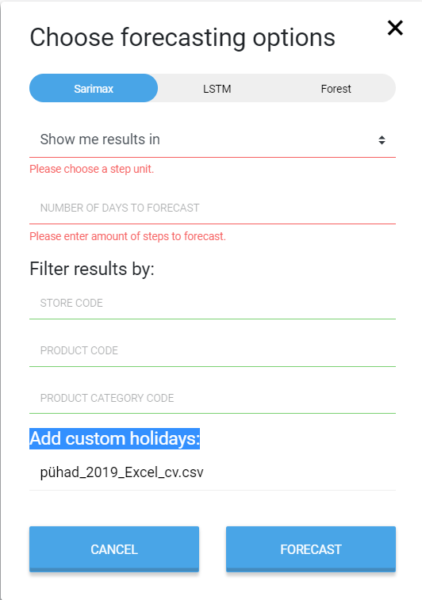
You will be presented with three machine learning options: Sarimax, LSTM and Forest. Since machine learning is based on so-called black-box testing – the contents of the box are irrelevant as long as it works as intended – the user doesn’t really need to delve into the specifics of each method. Instead, you should concentrate on grasping the essence of each solution to select the one delivering the best result for your data.
In addition to determining the model, the plugin also provides feedback on the quality of your data – is the data suitable and sufficient to make a forecast, etc. You can detect any discrepancies between the forecast and actual sales results by comparing the forecast and sales history of specific dates; it may also be possible to determine the causes of the discrepancy. Common causes relate to business-critical factors that are difficult to detect when reviewing vast amounts of data but may critically affect the sales effectiveness of a given product.
Select your preferred timeframe under “Show me results in”:
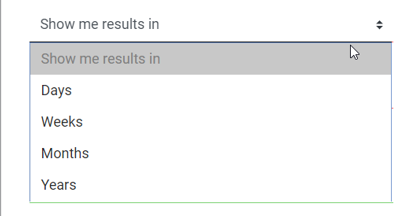
For example, if you select “Days”, you will be able to determine the length of the forecast in days under “Number of days to forecast”.
Enter the ID of the warehouse under “Store code”; “Product code” requires you to enter the code of a specific product and “Product category code” the ID of the product group in question.
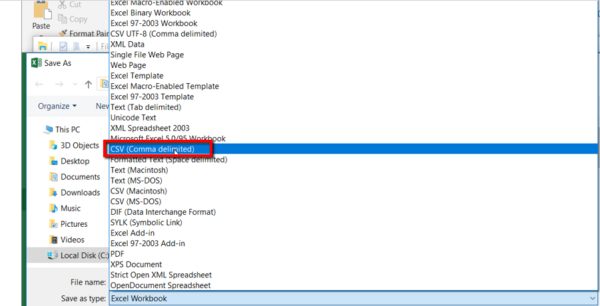
The “Add custom holidays” option allows you to upload an Excel sheet of relevant holidays. Click “Save as” to save the data as a csv file. You will be displayed the following:
Select the generated csv file and add it to the forecast:
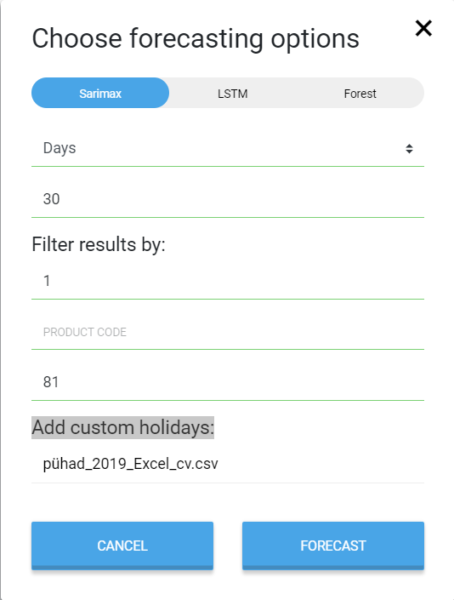
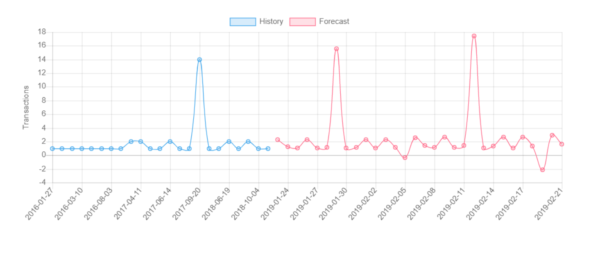
Continue by clicking “FORECAST“. The forecast will open shortly after the data has been saved:
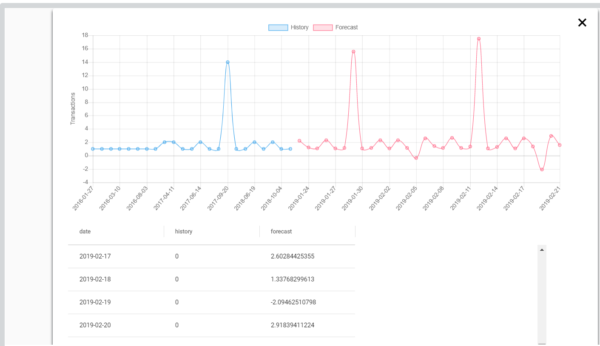
…
You have selected two date ranges: the sales date range used to generate the model and the forecast period. Note that the forecast period should be no more than one-third of the sales history date range it is based on. You may try a longer forecast period, but tests have shown that the results will be less accurate for longer date ranges. Furthermore, generating a forecast for a longer period of time may take hours.
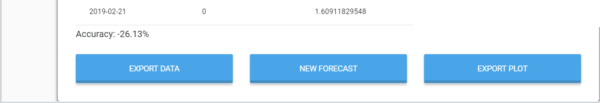
Once you have your forecast, you will be able to select one of three options:
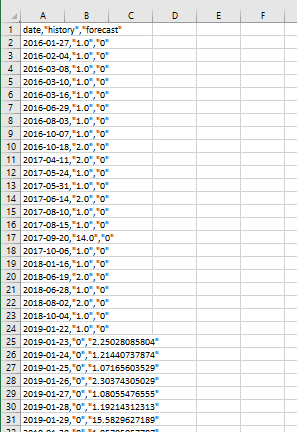
1 “EXPORT DATA” will generate a csv file of your forecast data.
2 “NEW FORECAST” allows you to generate a new forecast and displays the already familiar view
3 “EXPORT PLOT” generates a file titled forecastPlot.png: